
Required: fodjan Per dairy cow
If the documentation is managed well, you will get a good overview of relevant feeding key figures in the feeding controlling.
You can display the following evaluation in the feeding controlling in fodjan Pro:
- Feed intake
- Feed costs
- Feed efficiency
- Nitrogen efficiency
- Methane emission
Note: Which data is included in each case can be found in the information field for each diagram under the settings:
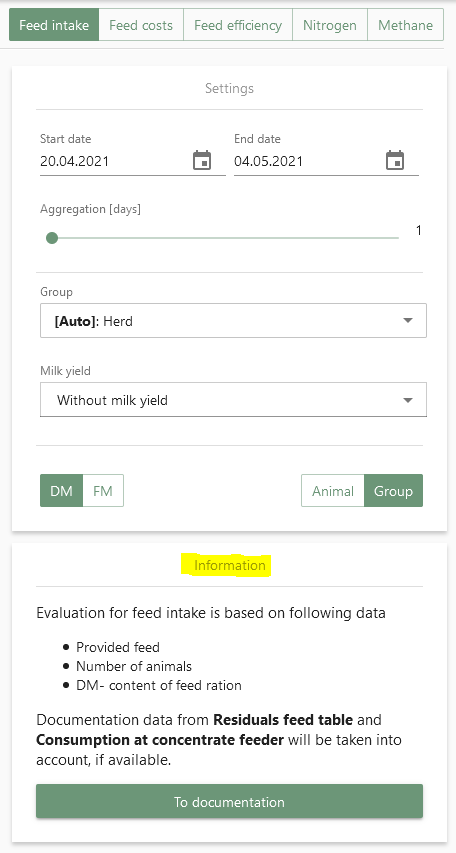
In addition to these evaluations in feed controlling, evaluations of mixing accuracy and feed consumption are also possible in fodjan, more on this here.
On the right, you will find a filter area for each report in the feeding controlling.

Here you can
- select the start and end date for the period you want to view.
- Under “Aggregation [days]” you can set how many days you want to summarise. This allows you to smooth your graph. You can also find out more about this function here.
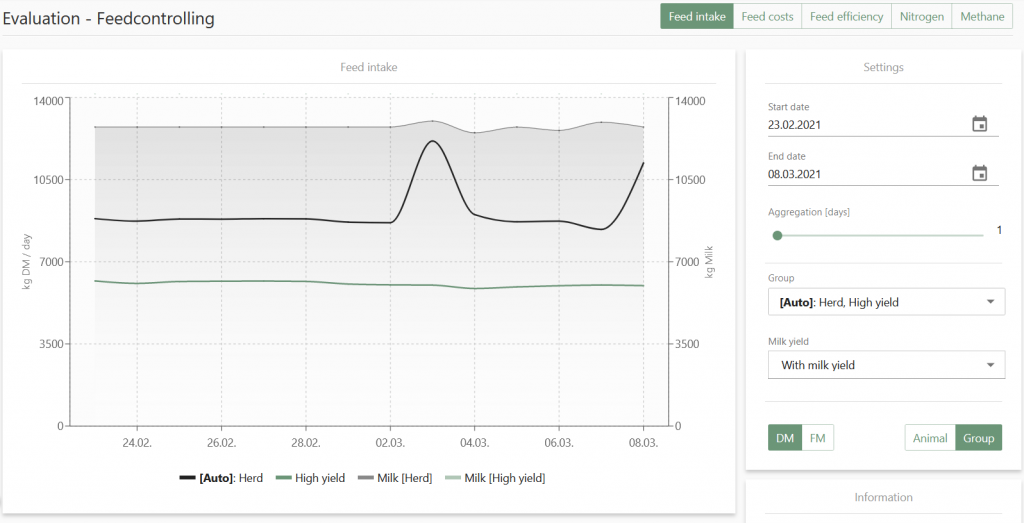
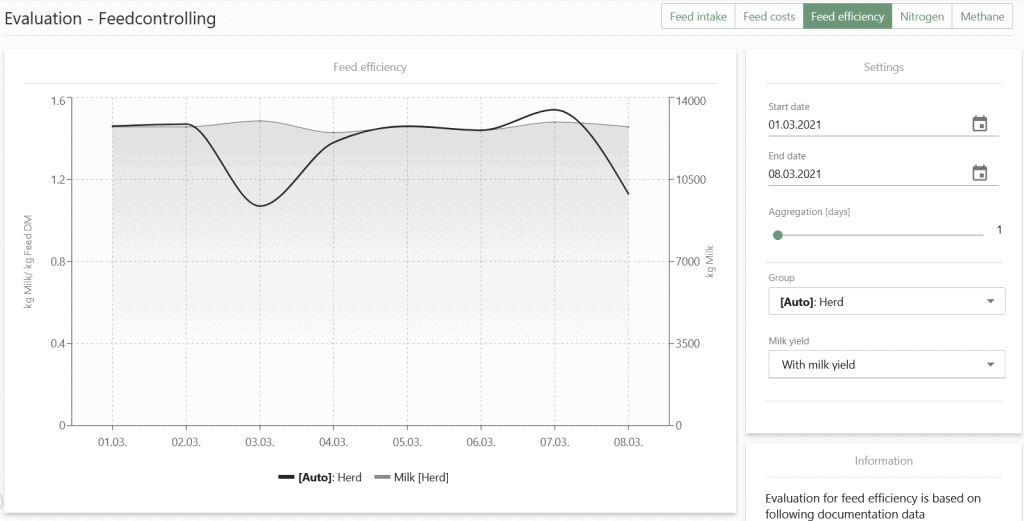
- In addition, you can also display the milk yield in the same graph. The values are assigned to the left y-axis (kg milk). You can select the following in the “Settings” under “Milk yield”:
- Without milk yield: Milk yield is not shown in the diagram.
- With milk yield: Milk yield is displayed in kg milk in the diagram.
- With milk yield ECM: Milk yield is shown in kg ECM in the diagram.
Note: For the milk graph, feed controlling uses the milk quantity from the documentation and the fat/protein values from the last uploaded milk quality data if none are available for the specific date.
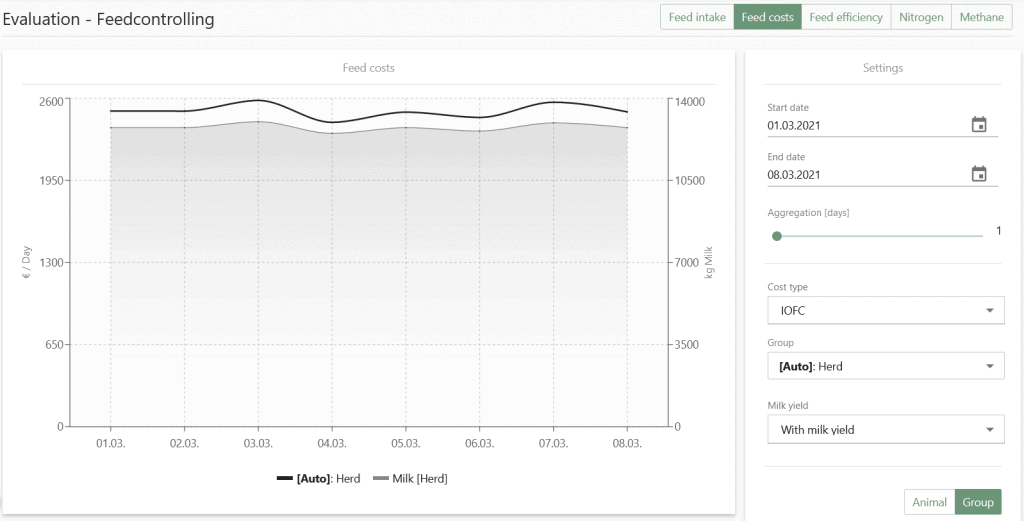
The milk yield is then shown in the diagram on the left in a grey graph. The area under this graph is coloured grey.
Example view:
In the following sections we would like to show you what you can have displayed in the individual evaluations.
Click on “Feed intake” in the top right-hand corner.
In order for evaluations to be displayed here, you must have entered the following values in the documentation or transferred them from interfaces:
- Feed template
- Number of animals
- DM content of mixed ration
- Feed residue feed table if available
- Concentrated feed consumption in the station, if available
The feed intake over the past 14 days is automatically displayed in kg DM (or FM) per day (black graph).
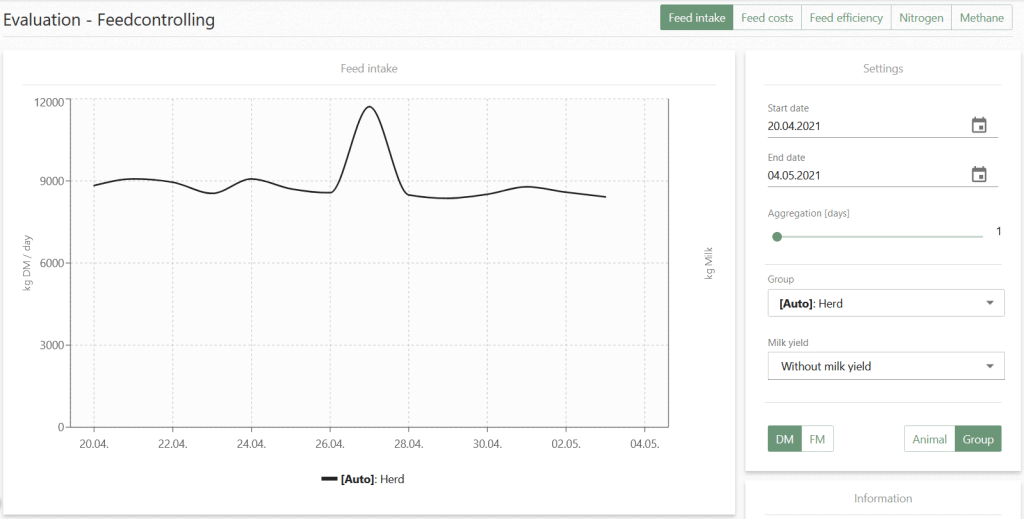
Additional settings for this report:
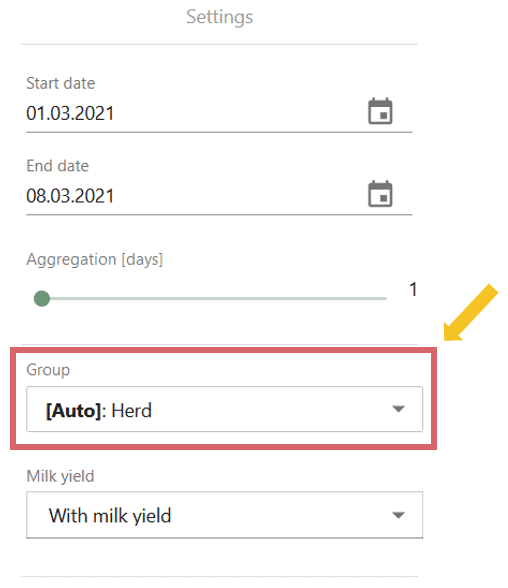
On the right in the settings under “Group” you can select one or more groups to be displayed. A maximum of three groups can be selected. Groups that you have selected are marked with a green tick.
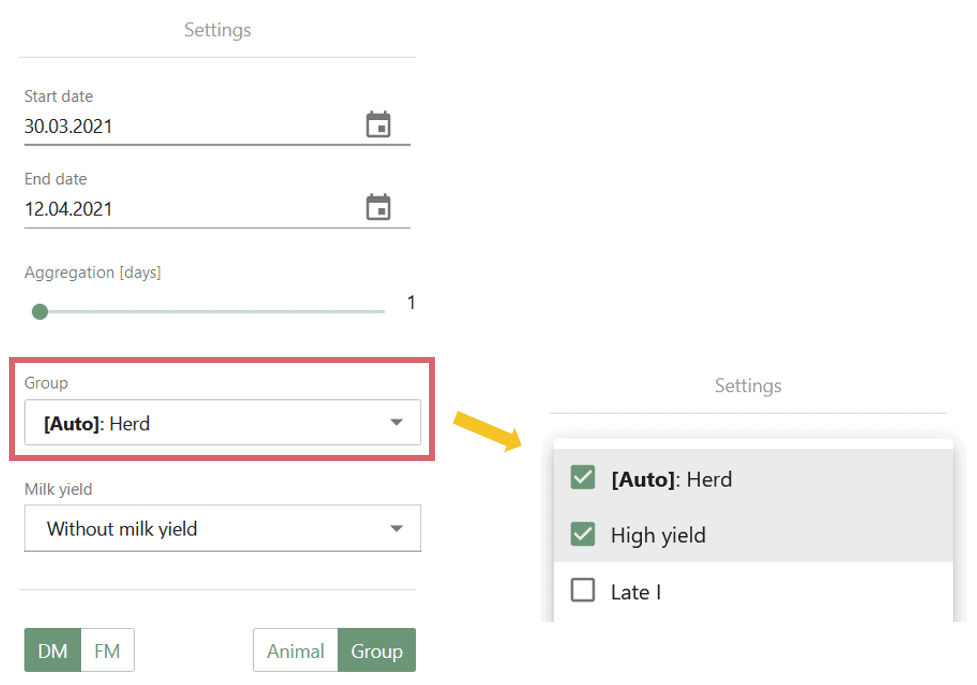
If there are fluctuations in feed intake, you can find out if this is due to only one or a few feed groups or if it is a herd problem.
- You can also choose between animal and group in the settings below. Depending on the selected setting, the daily feed intake in kg DM or FM per animal or for the entire group (in the default setting for the entire herd) is displayed on the left y-axis.
- In addition, you can choose between dry matter (DM) and fresh matter (FM) at the bottom of the settings. The selected setting is marked in green. The y-axis now shows the feed intake in kg FM or kg DM.
You will also find a feed intake evaluation in the fodjan app.
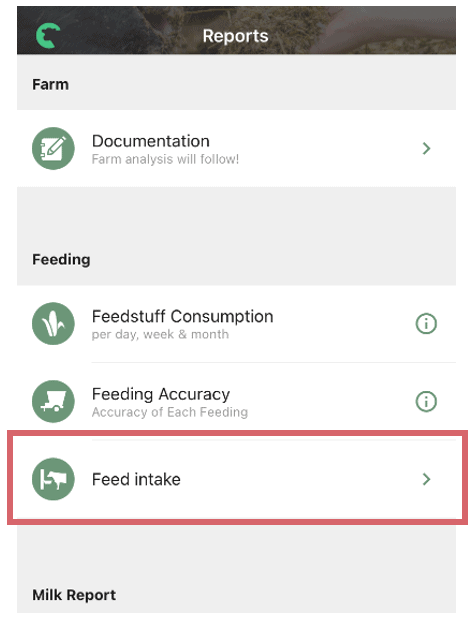
Click on “Reports” in the menu below.

Click on “Feed intake”:
The feed intake of the last 7 days is shown in a diagram. The average feed intake in kg DM is shown at the bottom, as well as the trend in feed intake over the last 7 days in “%”.
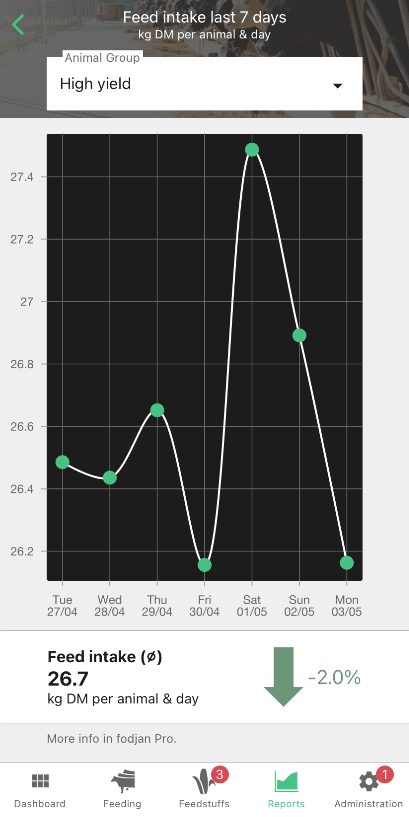
At the top you can select the feed group you want to display.
With the various settings of the feed cost evaluation you can see where the problems in the feeding on your farm may lie, e.g. whether problems can be traced back to individual feed groups, how strongly milk yield fluctuations affect economic parameters and much more.
To have the feed costs evaluated, click on “Feed costs” in the top right-hand corner.
In order for evaluations to be displayed here, the following values must be documented in the documentation:
- Feed supply
- Number of animals
- DM content of mixed ration
- Fodder residue Feeding table if available
- Concentrated feed consumption in the station, if available
In addition, the feed price from the feed stock is taken into account in the calculation and must be entered.
Additional settings for this report:
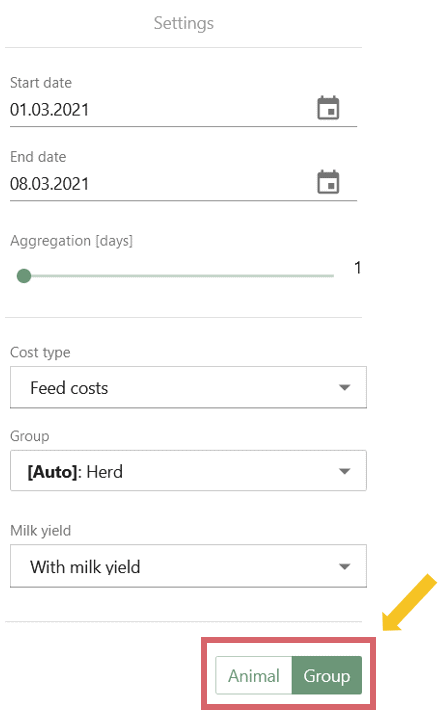
In the settings at the bottom right you can choose between animal and group (in the default setting entire herd) (selected setting is marked green).
In the settings under “Cost type” you can choose between the following costs or economic key figures:
- Total feed costs per day
- IOFC total per day, more on IOFC also here.
- Feed costs per kg milk per day
In the settings under “Group” you can select one, several or all (setting: herd) feed groups that you want to display in the diagram. A maximum of three groups can be selected.
Go to “Feed efficiency” at the top right:
In order for values to be evaluated here, the following values must be documented regularly in the documentation:
- Feed provision
- Number of animals
- DM content of mixed ration
- Milk quantity (when evaluating at group level, the milk quantity must also have been documented at group level)
- Residual feed on the feeding table, if available
- Concentrate consumption in the station, if available
Additional settings for this report:
On the right in the settings you can select one or more groups for which you want to display the feed efficiency under “Group”. A maximum of three groups can be selected. This way you can see whether changes in feed efficiency are due to individual groups or to the entire herd.
To view nitrogen efficiency evaluations, go to “Nitrogen” in the upper right corner. With this evaluation you can avoid large nitrogen surpluses in feeding. This is not only good for animal health and profitable feeding, but also reduces nitrogen inputs into the environment.
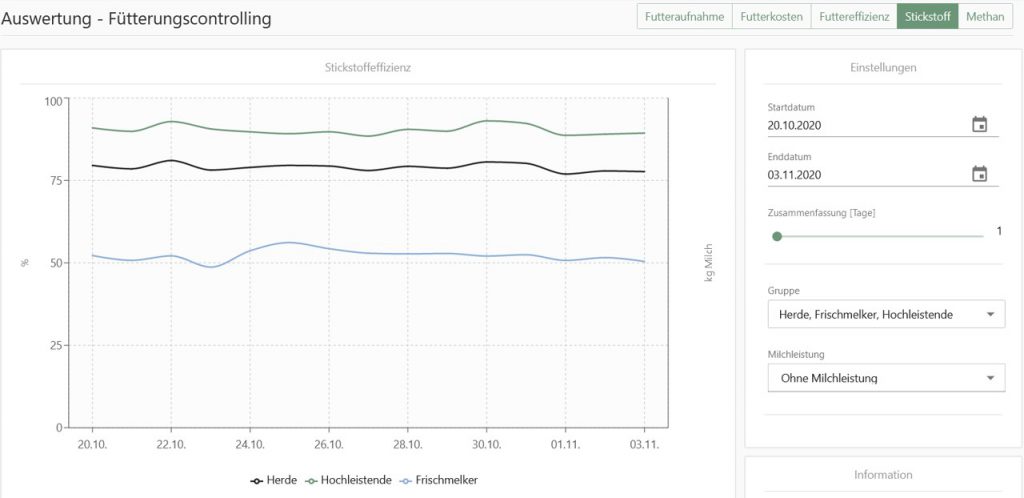
What does nitrogen efficiency mean? Nitrogen efficiency in this case means what percentage of the nitrogen from the crude protein (XP) in the feed actually ends up as nitrogen in the milk protein. To calculate the value, we therefore need the raw protein content of the feed and the protein content of the milk.
So that values can be evaluated here, the following values must be regularly documented in the documentation:
- Milk quantity
- DM content of mixed ration
- Reidual feed Feeding table if available
- Concentrated feed consumption in the station, if available
In addition, the milk protein content is necessary for the calculation. This is taken from the milk quality data (recommended) or from the milk report data.
Additional settings for this report:
In the settings you can select under “Group” if you want to have one or more groups displayed in a diagram. A maximum of three groups can be displayed at once.
For the evaluation of the methane emission, click on “Methane” in the upper right corner.
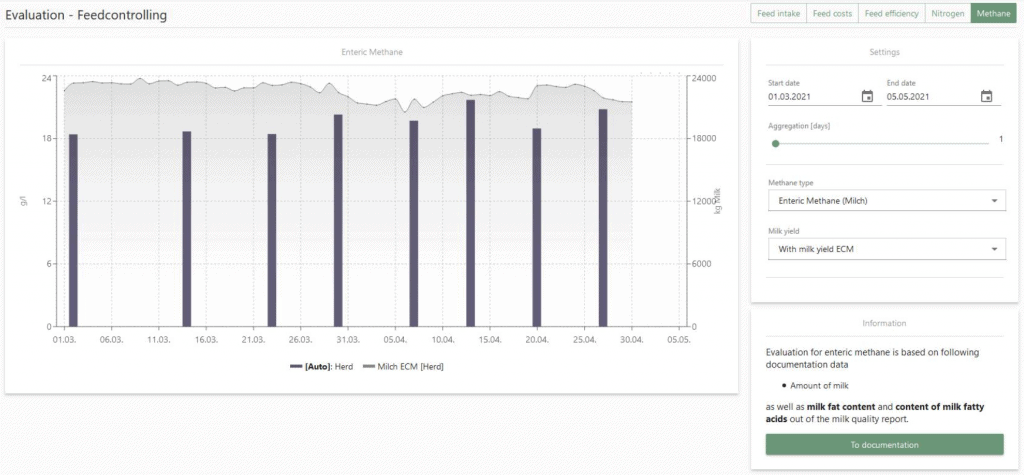
The evaluation of the methane emission is based on the following values:
- Milk quantity from the documentation
- Milk fat content and content of milk fat acids from the milk quality
Based on an estimation formula, the methane emission from feeding is estimated and displayed in a bar chart.
Additional settings for this report:
In the settings under “Methane type” you can choose between “Enteric methane (milk)” (based on total milk quantity) and “Enteric methane (ECM)” (based on milk quantity in ECM).
What is enteric methane? Enteric methane is the methane that is produced during the digestion process or fermentation in the forestomach system of the dairy cow.
See also
Using the milk report interface
Read more >
Overview: Reports in fodjan
Read more >
Milk quality report
Read more >
Milk report import doesn't work
Read more >
Jagged graph in feed controlling – what to do?
Read more >
Questions we couldn’t answer?
Simply keep searching here:
Contact us:
support@fodjan.de
or weekdays in in urgent cases:
+49 (0) 351 4188 6693