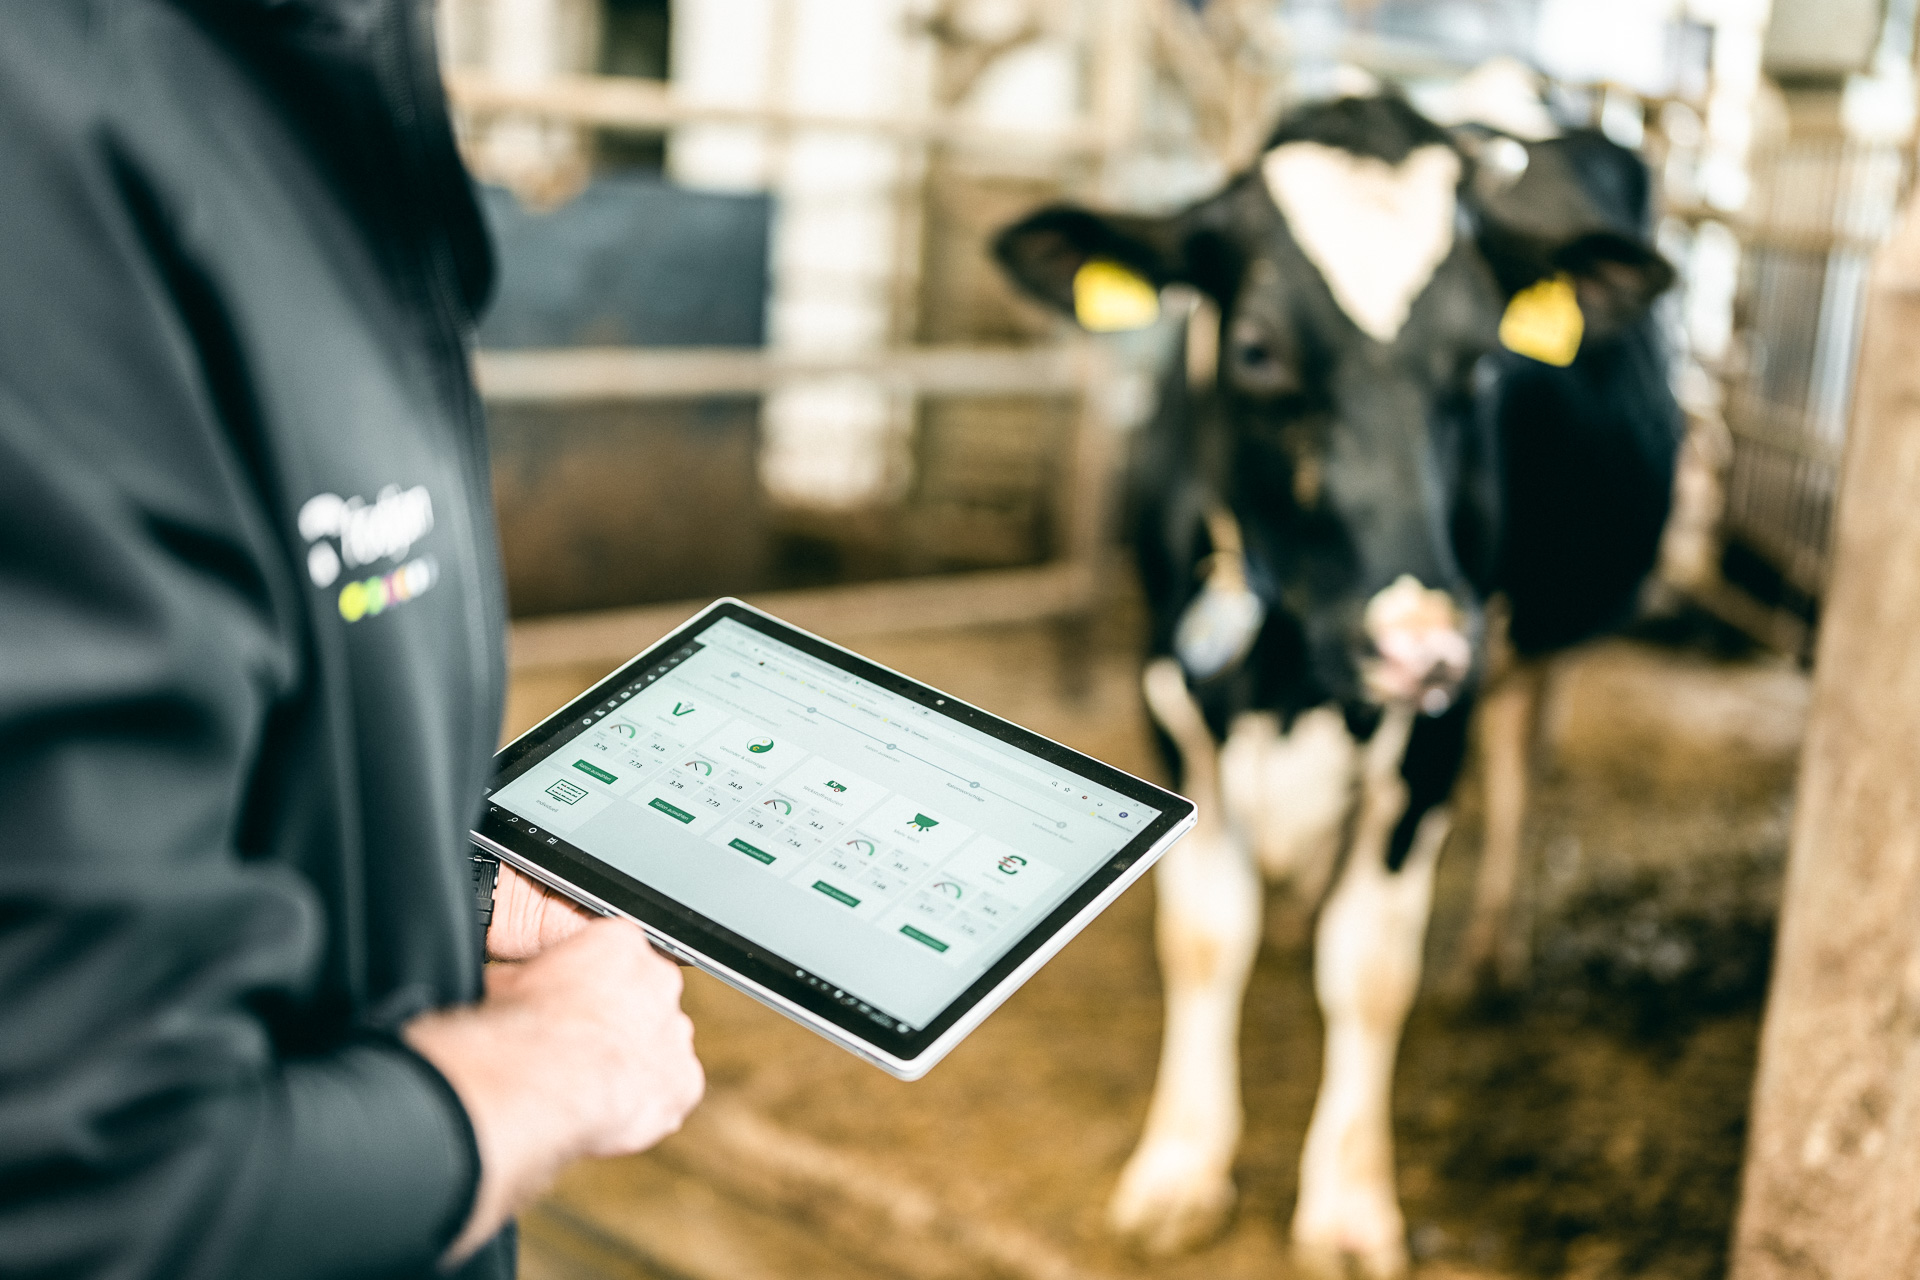
The reports in fodjan supplement the planning view of your feeds, feed groups and rations with reports on the real data of your farm – in line with our “feeding 360° approach”. This allows you to keep an eye on the actual and the target, to sustainably pursue your farm goals and to make adjustments to the planning on the basis of the findings from the reports.
Documentation – the basis of many reports
Documentation is not only a good tool for tracking certain key figures, but also feeds some of the reports, such as feeding controlling. You can get an overview of the functions of manual and automatic documentation with fodjan Pro and App here.
Mixing accuracy and feed consumption
Available for: fodjan Pro, fodjan Premium App
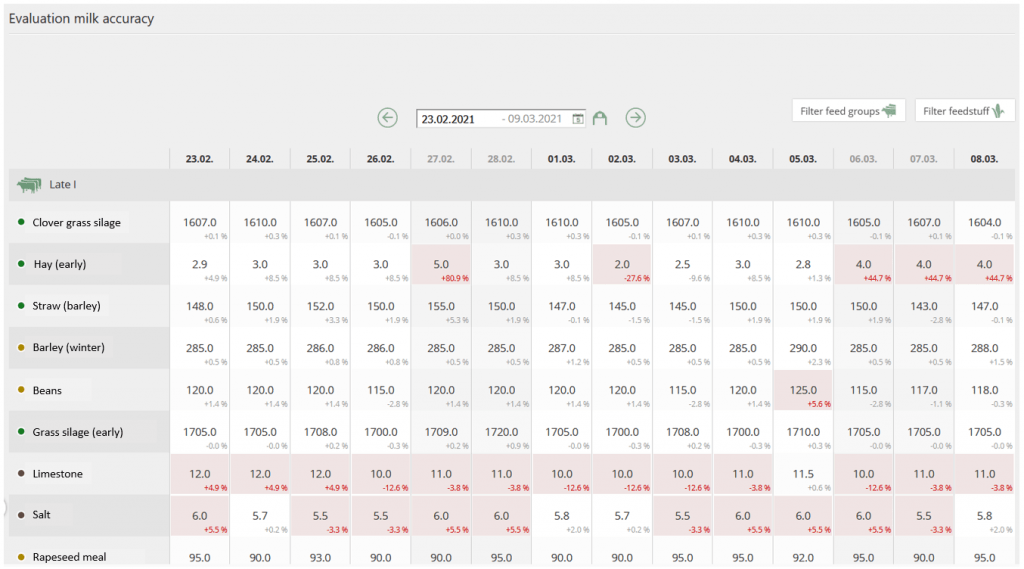
The evaluation for mixing accuracy shows you the feed consumption of each feed in each feed group from the real feeding and the deviation from the planned quantities in the ration. In the fodjan App there is also an extra feed consumption evaluation.
Feed controlling
Available for: fodjan Pro
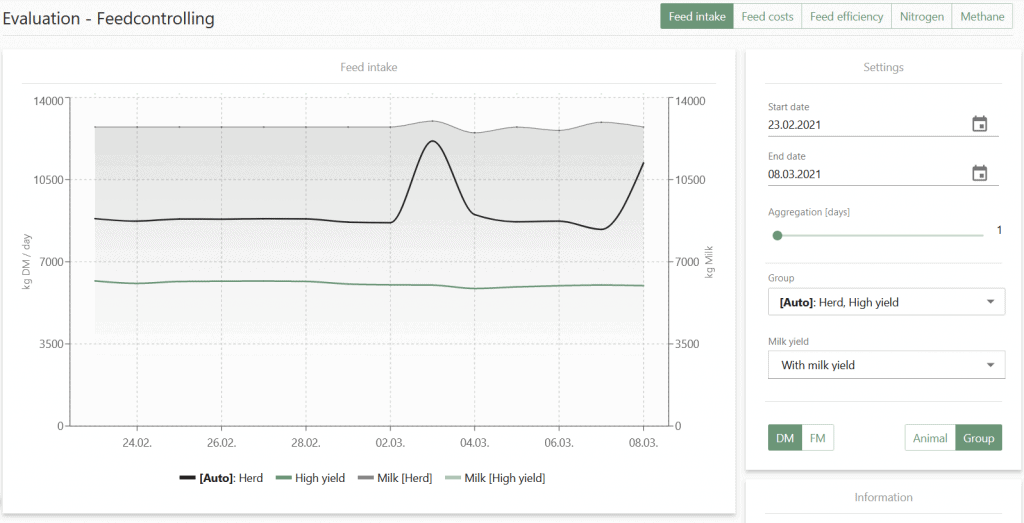
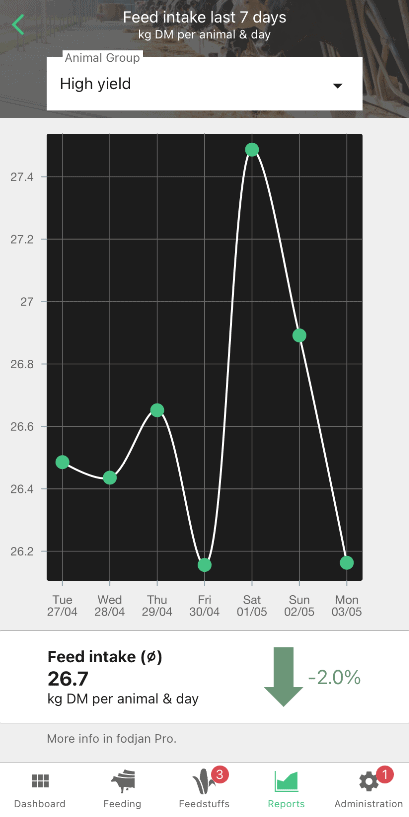
In the feeding controlling, feed intake, feed efficiency, feed costs, nitrogen and methane are graphically displayed and evaluated, partly also in relation to milk yield. In addition, fodjan Pro users can display and evaluate the feed intake over time in the fodjan app. In addition, the app gives warnings by push notification in case of deviations of more than 10%.
You can find more information on feeding controlling here.
Milk Report
Available for: fodjan Pro, fodjan Premium App
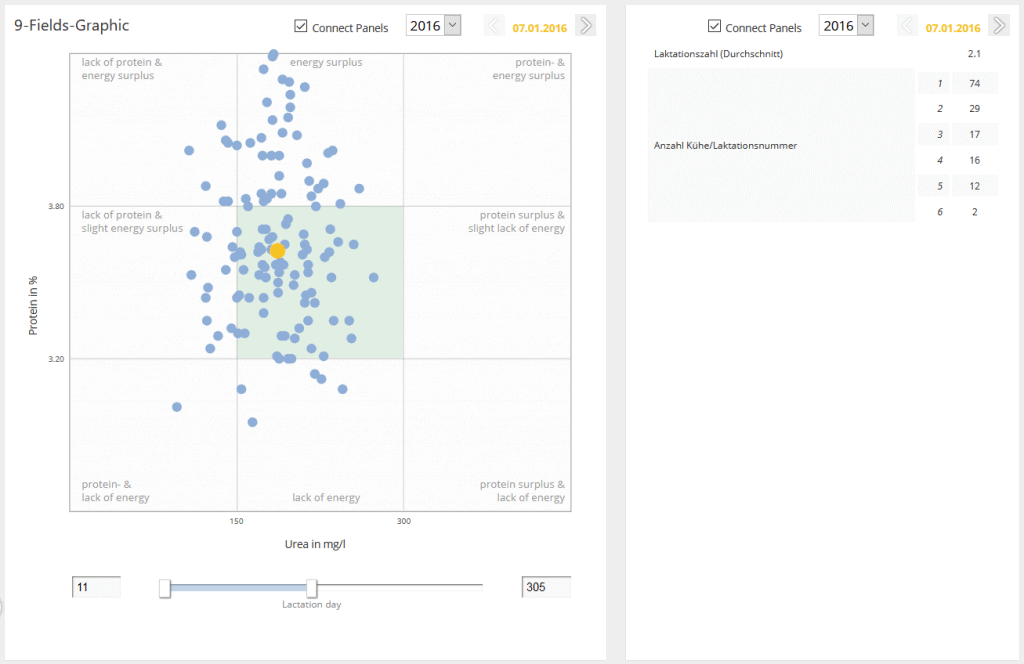
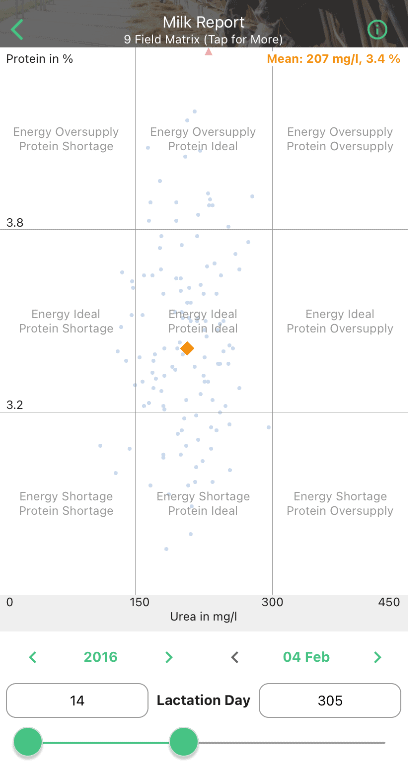
In fodjan you can display your milk report data in clear graphics. This allows you to view the development of your milk parameters in connection with feeding and, for example, filter by specific lactation periods to see supply deficiencies or surpluses at a glance.
You can find more information about the milk report here:
Milk quality
Available for: fodjan Pro
With the import of your milk quality data you get an overview of the different tested parameters and can compare them clearly over time.
You can find more information about milk quality in the following articles:

Milking robot data in the AMS (automatic milking systems) report
Available for: fodjan Pro
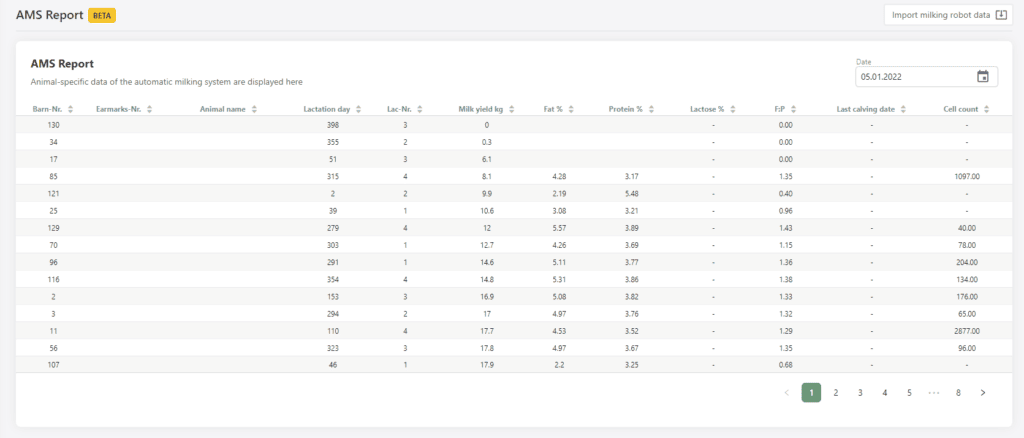
The interface for the manual import of data from milking robots and systems or also called AMS (automatic milking systems) also opens up the AMS report in the evaluations, which shows current animal data, milk yield and quality.
For fattening cattle: Growth curve report
Available for: fodjan Pro on fattening cattle farms
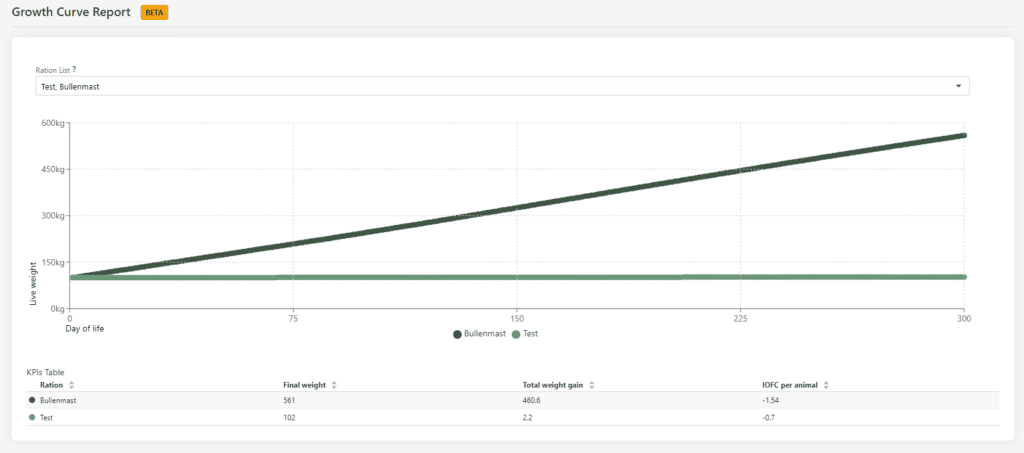
The new evaluation can be found in the menu under Reports -> Growth curve report. The growth curve currently shows linearly from the data of the feed group how the growth of a feed group can be predicted:
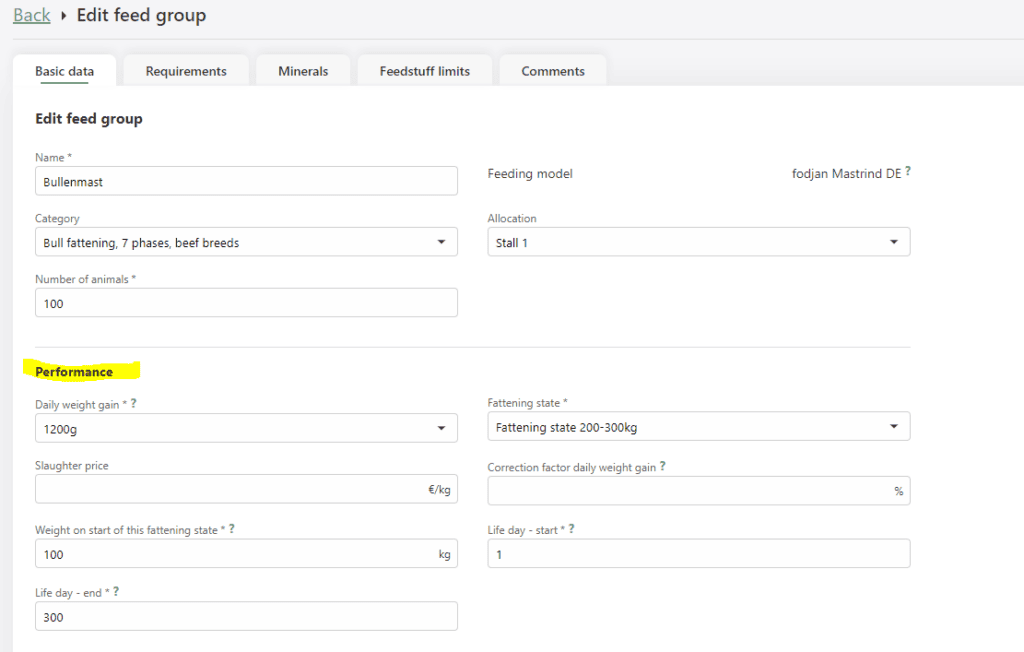
In the feed group data, select the desired group for editing and find the “Performance” section, which is responsible for the curve:
See also
Using the milk report interface
Read more >
Milk quality report
Read more >
Milk report import doesn't work
Read more >
Jagged graph in feed controlling – what to do?
Read more >
Feeding accuracy and consumption
Read more >
Questions we couldn’t answer?
Simply keep searching here:
Contact us:
support@fodjan.de
or weekdays in in urgent cases:
+49 (0) 351 4188 6693
